Monday, June 29, 2009

Isotachs


Isotach maps include lines connecting equal wind speeds in a given area.
This map was used in research to help examine weather conditions prior to an outbreak of tornadoes in Oklahoma and Kansas that occurred on May 3, 1999.
http://www.spc.noaa.gov/publications/thompson/3may99/waf.htm


Thursday, June 25, 2009

Isobars


Isobar maps show areas of equal air pressures.
This map shows air pressures throughout the United States. It also shows fronts as well as precipitation.
http://www.ametsoc.org/amsedu/online/info/samplecourse/b_act.html


LIDAR


LIDAR (light detecting and ranging) is a method of detecting distant objects and determining their position, velocity, or other characteristics by analysis of pulsed laser light reflected from their surfaces.
In this example, the U.S. Geological Survey (USGS) and NASA scientists studied Mount St. Helens using LIDAR technology to analyze changes in the surface elevation of this crator which began deforming in late September 2004. Elevation differences in the crater were found between two airborne LIDAR surveys conducted in September 2003 and October 4, 2004. The image is a computer-generated representation of the October 4 topography. In this image colors indicate areas of change.
http://www.nasa.gov/centers/goddard/earthandsun/mshelenslidar.html


Doppler Radar


Doppler radar is used to show velocities of precipitation.
This Doppler image was taken as Hurricane Claudette made landfall in Texas on July 15, 2003.
http://www.noaanews.noaa.gov/stories/s1192.htm

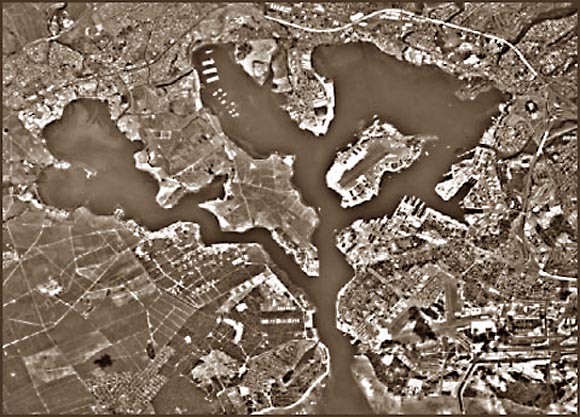
Black and White Aerial Photo


This black and white photo is of Pearl Harbor.


Wednesday, June 24, 2009

Infrared Aerial Photo


Infrared photographs are created using a film that better shows features that may have similar shades between them in an arial black and white photo. It is often used to document changes in environment (vegitation growth or destruction), insects, etc.
This infrared photo shows Onondaga Lake Watershed in New York.

Cartographic Animation


Cartographic animations show changes in a graphic over time.
This cartographic animation shows wind speeds and direction throughout the world over the period of one year.