Legend's Maps

Friday, July 24, 2009

KML Remote Sensing


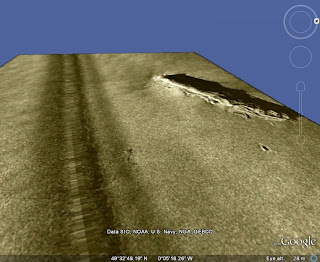
KML is a type of file format used to display geographic data. GoogleEarth uses this type of format when displaying their maps of the Earth. Remote sensing is used to produce these files. Remote sensing is a technique used to collect data about the Earth without taking a physical sample of the Earth's surface. This is done by placing a sensor to measure the energy from the sun reflected from the earth. This information obtained can be displayed as a digital image or as a photograph.

This example of a KML image was taken from a sunken French submarine off the coast of Europe. The image was credited to the US Navy and is taken from an Eye alt of 28 meters.


Monday, July 13, 2009

Star Plot


The star plot is a method of displaying multivariate data. Each star represents a single observation. Each observation is represented as a star-shaped figure with one ray for each variable. For a given observation, the length of each ray is made proportional to the size of that variable.
This example is showing information on automobile data-size, price, performance, etc.
http://www.math.yorku.ca/SCS/sugi/sugi16-paper.html

Correlation Matrix


A Correlation Matrix is a table that shows the degree of relationship between two variables.
This example shows the relationship of tissue samples in a genetics study. The red squares are most closely related.
http://www.livestockgenomics.csiro.au/Genome_to_Phenome/

Similarity Matrix


A Similarity Matrix shows how similar two variables are.
This example shows similarities in 10 different strands of bacteria found along the coast of Pakistan. This was used to catalog bacterial strains that are disappearing because of pollution.
http://www.jbaas.com/articles/vol_2_n2_c7.php

Stem and Leaf Plot


A Stem and leaf plot is a method for showing the frequency with which certain classes of values occur. Typically the "stem" is the left hand column containing the tens digits and the "leaf" is in the right column and contains the ones.
This example shows the heights of 200 adults. The left (tens column) contains the number of whole inches and the right column (ones) shows the decimal of that inch. When a number is repeated in the ones column, more than one person was that height.
http://nyjm.albany.edu:8000/~reinhold/m308/Assgnmt1_HowTo.htm

Box Plot


Box Plots are a great way to see the of variability in data. They show a measure of the median, average and dispersion. They are useful when comparing two or more sets of data.
This example compares the number of damaged packages in two shifts of a company. While the medians differ (as did the averages), the data have considerable overlap and the difference in shifts probably do not account for the damages. A person looking at this plot would know that defects are probably being caused by some reason that occurs on both shifts.
http://www.introtoie.com/C05-01.html

Histogram

Histograms are graphical representations of data sets. The bar's height represents the frequency and the bar's width is proportional to the classes in which the data has been divided.
This example shows the distribution of salaries of the Acme Corporation. By looking at the data in this form, we can see that the majority of employees make the middle-range salary ($44,000-$54,000).
http://www.statcan.gc.ca/edu/power-pouvoir/ch9/histo/5214822-eng.htm