Friday, July 24, 2009

KML Remote Sensing


KML is a type of file format used to display geographic data. GoogleEarth uses this type of format when displaying their maps of the Earth. Remote sensing is used to produce these files. Remote sensing is a technique used to collect data about the Earth without taking a physical sample of the Earth's surface. This is done by placing a sensor to measure the energy from the sun reflected from the earth. This information obtained can be displayed as a digital image or as a photograph.

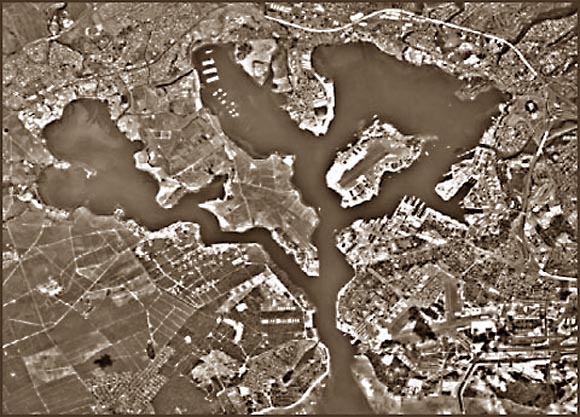
This example of a KML image was taken from a sunken French submarine off the coast of Europe. The image was credited to the US Navy and is taken from an Eye alt of 28 meters.


Monday, July 13, 2009

Star Plot


The star plot is a method of displaying multivariate data. Each star represents a single observation. Each observation is represented as a star-shaped figure with one ray for each variable. For a given observation, the length of each ray is made proportional to the size of that variable.
This example is showing information on automobile data-size, price, performance, etc.
http://www.math.yorku.ca/SCS/sugi/sugi16-paper.html

Correlation Matrix


A Correlation Matrix is a table that shows the degree of relationship between two variables.
This example shows the relationship of tissue samples in a genetics study. The red squares are most closely related.
http://www.livestockgenomics.csiro.au/Genome_to_Phenome/

Similarity Matrix


A Similarity Matrix shows how similar two variables are.
This example shows similarities in 10 different strands of bacteria found along the coast of Pakistan. This was used to catalog bacterial strains that are disappearing because of pollution.
http://www.jbaas.com/articles/vol_2_n2_c7.php

Stem and Leaf Plot


A Stem and leaf plot is a method for showing the frequency with which certain classes of values occur. Typically the "stem" is the left hand column containing the tens digits and the "leaf" is in the right column and contains the ones.
This example shows the heights of 200 adults. The left (tens column) contains the number of whole inches and the right column (ones) shows the decimal of that inch. When a number is repeated in the ones column, more than one person was that height.
http://nyjm.albany.edu:8000/~reinhold/m308/Assgnmt1_HowTo.htm

Box Plot


Box Plots are a great way to see the of variability in data. They show a measure of the median, average and dispersion. They are useful when comparing two or more sets of data.
This example compares the number of damaged packages in two shifts of a company. While the medians differ (as did the averages), the data have considerable overlap and the difference in shifts probably do not account for the damages. A person looking at this plot would know that defects are probably being caused by some reason that occurs on both shifts.
http://www.introtoie.com/C05-01.html

Histogram

Histograms are graphical representations of data sets. The bar's height represents the frequency and the bar's width is proportional to the classes in which the data has been divided.
This example shows the distribution of salaries of the Acme Corporation. By looking at the data in this form, we can see that the majority of employees make the middle-range salary ($44,000-$54,000).
http://www.statcan.gc.ca/edu/power-pouvoir/ch9/histo/5214822-eng.htm

Sunday, July 12, 2009

Parallel Coordinate Graph


Parallel Coordinate graphs places multiple sets of data on one chart. These are particularly good for seeing trends and outliers.
This example relates a car's price to other features important to a person purchasing a new car.
http://florence.acadiau.ca/collab/hugh_public/index.php?title=GGobi_Intro

Triangular Plot


A Triangular Plot is one that displays three sets of data or variables. The intersection of the three axis gives the class of the unknown.
This triangular plot shows carbonate rock composition from Tennessee, West Virginia and Pennsylvania in terms of the three components that represent carbonates, clays, and silica. The figures were calculated from published rock analyses.

Windrose


A Windrose is a tool used by meteorologists to represent which direction wind is blowing from (wind direction) and speed in a particular location.
This example of Yakima,Washington shows the wind's top speed was 17-22 knots at recording time.
http://www.climate.washington.edu/climate.html

Climograph

A Climograph shows a location's average temperature and precipitation. This is used to predict an area's climate.
This is an example of a climograph of Manaus, Brazil. From this information we see that the area has lower precipitation on the warm months and peaks in precipitation in October.
http://www2.volstate.edu/kbell/climographs.htm

Population Profile

A Population Profile is a chart that shows the number of people as a function of their ages.
It could inlude age/ sex distributions for a given region.
This profile is comparing Crookwell and Gunning Shires in Upper Lachlan. By looking at the data we see the population of 15-59 year olds is increasing in the Gunning shire while the Crookwell shire's population is increasing among the 60+ group.
http://www.envcomm.act.gov.au/soe/soe2004/UpperLachlan/population.htm

Saturday, July 11, 2009

Scatterplot


Scatter plots are similar to line graphs in that they use horizontal and vertical axes to plot data points. Scatter plots show how much one variable is affected by another. The relationship between two variables is called their correlation . Scatter plots usually consist of a large body of data. The closer the data points come when plotted to making a straight line, the higher the correlation between the two variables, or the stronger the relationship.
The above plot shows the relationship between ages of husbands and wives.
http://cnx.org/content/m10950/latest/

Index Value Plot

An Index Value Plot is a type of visualization map in which an index value is plotted on a line map. It uses index value instead of an absolute value.
This is an example of relative daily index closings among markets around the world.
http://www.mathworks.com/products/demos/shipping/garch/garchcopulaevtdemo.html?product=GA

Lorenz Curve

A Lorenz Curve shows an unequal distribution between two variables as a curve. The further away from a 45 degree angle, the greater the inequality.
In this example,the straight green line is the Lorenz curve of an idealized perfectly egalitarian society - where everybody has exactly the same income. The red Lorenz curve - horizontal and then vertical - is that for the extreme authoritarian or totalitarian society where one person has all the income. Curves for societies with intermediate income distributions are also shown.
http://chesters.org/marvin/GINI/index.html

Bilateral Graph

Bilateral Graphs are useful when data has both positive and negative values.
This graph represents the a lowering unemployment rate as presented by the US Treasury's press release. The line for this is not going straight down (all negative).
http://www.ustreas.gov/press/releases/

Standardized Choropleth Map

A Standardized Choropleth map is one that has been areally averaged.
This is an example showing the number of people per square kilometer in Astoria, Oregon.
http://pubs.usgs.gov/tm/tm11c2/

Thursday, July 9, 2009

Choropleth Map


A choropleth map is a type of thematic map in which areas are shaded in proportion to the measurement of the data being displayed in the map. Although they are based on statstical data, the data collected is shown over previously defined regions.
In this example, the variations are among the divorce rates between 1980 and 1990 at both the state and county level.


Wednesday, July 8, 2009

Univariate Choropleth Map

Univariate Choropleth maps show a single data set (variable).
This map shows the median income of the population of each state as provided by the United States Census Bureau.
http://mikesmaps.blogspot.com/

Bivariate Choropleth Map


Bivariate Choropleth maps show two types of data (variables) on a single map.
This bivariate map shows both the margin of victory for each presidential candidate and the voting age of those who voted.

Tuesday, July 7, 2009

Unclassed Choropleth Map


Unclassed Choropleth maps do not have defined intervals. The numeric values are converted into proportional degrees of darkness.
In this map, the darker the shading, the higher the fertility rate for countries in Europe. There is not an exact fertility rate range for each country.

Classed Choropleth Map

A Classed Choropleth map contains data that is color coded. The amount or color of shading corresponds to the key. The data is combined into smaller groups and is portrayed in intervals.
This map is classified into four groups based on the number of males per 100 females in each state.
http://my.ilstu.edu/~jrcarter/Geo204/Choro/

DOQQ


Digital Orthographic Quarter- Quads (DOQQs) are aerial photographs that have been corrected to remove any distortion. Doing this allows the photos to be used as flat maps with more accurate measurement.
This DOQQ example is of Sabine Pass, Texas. It contains enlargement to show one meter resolution.

DEM

Digital Elevation Maps (DEMs) show terrain topographyin Raster format.
This DEM example shows the elvations of areas within North America.

DLG


A DLG (Digital Line Graph) maps show boundaries, roads, and other various information found on topographical maps. DLGs are a form of graphic information system.
This is a DLG of Columbus, Georgia. It contains roads (red lines), trails (black lines) and olympic venues (green area).

Thursday, July 2, 2009

DRG


A digital raster graphic (DRG) is a type of U.S. Geological Survey. It is a form of digital map.
This one is of Evergreen Lake and Golf Course.
http://www.mapmart.com/Products/TopographicalMaps/SeamlessDRG.aspx


Isopleth


An Isopleth map shows a feature by connecting lines of equal value.
In this example, the area around three municipal waste incinerators in Jacksonville was examined. The extent of a toxic chemical average (100 micrograms per meter) was noted by the isopleth line.
http://www.stonelions.com/Jacksonville.htm

Isopach

An Isopach map consists of lines connecting places of equal value (thickness) for a given theme such as rainfall or temperature.
This map shows the thickness in feet of shale deposition along the Appalachian Basin. The purple area is a thinner area and the red is the thickest.
http://www.searchanddiscovery.net/documents/2007/07022lash/index.htm


Isohyets

Isohyet maps are used in recording amounts of precipitation during a specific period.
This isohyet map was used to show average rainfall in milimeters. The information provided will help farmers choose which clover to grow based on his/her location on the map.
http://www.dpi.nsw.gov.au/agriculture/field/pastures-_and_-rangelands/establishment/clover/part-f---choosing-the-right-sub-clover-v


Monday, June 29, 2009

Isotachs


Isotach maps include lines connecting equal wind speeds in a given area.
This map was used in research to help examine weather conditions prior to an outbreak of tornadoes in Oklahoma and Kansas that occurred on May 3, 1999.
http://www.spc.noaa.gov/publications/thompson/3may99/waf.htm


Thursday, June 25, 2009

Isobars


Isobar maps show areas of equal air pressures.
This map shows air pressures throughout the United States. It also shows fronts as well as precipitation.
http://www.ametsoc.org/amsedu/online/info/samplecourse/b_act.html


LIDAR


LIDAR (light detecting and ranging) is a method of detecting distant objects and determining their position, velocity, or other characteristics by analysis of pulsed laser light reflected from their surfaces.
In this example, the U.S. Geological Survey (USGS) and NASA scientists studied Mount St. Helens using LIDAR technology to analyze changes in the surface elevation of this crator which began deforming in late September 2004. Elevation differences in the crater were found between two airborne LIDAR surveys conducted in September 2003 and October 4, 2004. The image is a computer-generated representation of the October 4 topography. In this image colors indicate areas of change.
http://www.nasa.gov/centers/goddard/earthandsun/mshelenslidar.html


Doppler Radar


Doppler radar is used to show velocities of precipitation.
This Doppler image was taken as Hurricane Claudette made landfall in Texas on July 15, 2003.
http://www.noaanews.noaa.gov/stories/s1192.htm

Black and White Aerial Photo


This black and white photo is of Pearl Harbor.


Wednesday, June 24, 2009

Infrared Aerial Photo


Infrared photographs are created using a film that better shows features that may have similar shades between them in an arial black and white photo. It is often used to document changes in environment (vegitation growth or destruction), insects, etc.
This infrared photo shows Onondaga Lake Watershed in New York.

Cartographic Animation


Cartographic animations show changes in a graphic over time.
This cartographic animation shows wind speeds and direction throughout the world over the period of one year.


Statistical Map


Statistical maps show elements of importance or interest or pertaining to a theme. They are also called distribution maps.
This is a map of a person's brain. The statistics in this map represent signals to the brain in an experiment after the subject was made "breathless".
http://symptomresearch.nih.gov/chapter_23/sec8/cahs8pg1.htm

Thursday, June 18, 2009

Cartogram


Cartograms are maps in which a thematic mapping variable is substituted for land area. The space of the map is distorted to convey the information of this alternate variable.
This is a Cartogram showing the results of the Electoral College in the 2004 Presidential election. Dark blue represented strong democratic states while dark red were strong republican. Outlines meant the state was barely one way and white were exactly tied. This cartogram is not a true map.

Flow Map


Flow maps are like a flow chart. They are often used for sequencing or ordering information. They also show amount of traffic or flow within a region.
This flow map shows telecommunications traffic flow among European nations. The thicker the line, the more minutes shared between the two countries in millions of minutes. This particular map also includes a proportional circle map representing the country's outgoing traffic to all other countries.

Isoline Map

Isoline maps have lines that connect points of the same value. They are also called isograms.
This is an example of an Isoline map showing precipitation of Washington in 1996. By connecting points of the same value, isolines are effective because they quickly communicate distributions being examined.

Friday, June 12, 2009

Proportional Circle Map


Proportional Circle maps use the size of a circle to represent the presence and size of a feature.
This map shows Impact- generated tsunamis. There are 185 known impact craters on the Earth. The size of circle is proportional to the crater diameter. Red color represent the impacts on land, light blue represent those in the water.
http://tsun.sscc.ru/tgi_9.htm

Monday, June 8, 2009

Dot Distribution Map


Dot Distribution maps use dots to show the presence of a feature.
This Dot Distribution represents population of the United States as indicated by the 2000 Census. The brighter the dot, the more dense the population in that area.
http://www.census.gov/geo/www/mapGallery/

Propaganda Map


Propoganda maps aim to influence the audience toward some cause.
According to the text surrounding the map, "Arab propagandists and biased irresponsible news services call Israel "expansionist" and the "aggressor" against Arab peoples'. From this map, one would see that Israel appears to be the smallest country by far- How could it be the aggressor? The cartographer emphasises the size of Israel in it's defense. http://israelsmessiah.com/palestinian_refugees/israel_vs_arabs.htm

Hypsometric Map


Hypsometric maps are topographic maps that shows elevations with color sequences that fill spaces between contours.

This Hypsometric map shows the elevations of Kzylorda using various color tones. In this hypsometric map, shades of green are used for lower elevations, shades of yellow or tan for medium elevations, and reds and/or browns for higher elevations.
In this example, the sea is about 50 meters below sea level as indicated by the scale. The highest mountain areas are dark brown and are about 3000 meters.


http://lu.com/odlis/odlis_h.cfm

Wednesday, May 20, 2009

Topographic Map


Topographic maps use contour to show elevation. Topographic maps are different from other maps in that they show both the horizontal and vertical positions of the terrain. Through a combination of contour lines, colors, and symbols, this topographic map portrays the shape and locations of mountains, forests, rivers, lakes, roads, trails, and many other natural and man-made features.Narrow contours represent peaks.
This is an example of a topographic map that could be used to hike Oconee State Park and the Oconee Trail (represented with the red line).

Cadastral Map


Cadastral maps are made from land surveys.
This cadastral map was made from various land surveys (cadastral plans). It shows each property on the island as well as which are for sale and beachfront.


Tuesday, May 19, 2009

PLSS Map


PLSS maps show public land records.
This is an example of a PLSS map showing baselines and meridian lines of public owned land in the southeast United States. This map type would be used to further subdivide the land into townships and parcels.
http://www.rootsweb.ancestry.com/~alfrankl/landrecords.htm


Thematic Map

Thematic maps provide specific information about places.


This example is a thematic map showing median income in the United States.
http://www.visualizingeconomics.com/2007/09/18/united-states-income-map-2006-by-state/

Planimetric Map


A planimetric map is one without elevations.
This map is a planimetric representation of barracks and surrounding area in Vancouver. It shows horizontal information of the fort without showing it's elevation.
http://www.nps.gov/history/history/online_books/fova/clr/clr2-5c.htm

Friday, May 15, 2009

Mental Map

This mental map is an abstract portrayal of winter in Quebec. The photograph is the author's perceived view of what life in her new city is like wandering through the snow. Photography is one way to map the world around us.
http://www.suecorr.com